- Research
- Open access
- Published:
Quantitative proteomic analysis shows involvement of the p38 MAPK pathway in bovine parainfluenza virus type 3 replication
Virology Journal volume 19, Article number: 116 (2022)
Abstract
Background
Bovine parainfluenza virus type 3 (BPIV3) infection often causes respiratory tissue damage and immunosuppression and further results in bovine respiratory disease complex (BRDC), one of the major diseases in dairy cattle, caused huge economical losses every year. However, the pathogenetic and immunoregulatory mechanisms involved in the process of BPIV3 infection remain unknown. However, the pathogenetic and immunoregulatory mechanisms involved in the process of BPIV3 infection remain unknown. Proteomics is a powerful tool for high-throughput identification of proteins, which has been widely used to understand how viruses interact with host cells.
Methods
In the present study, we report a proteomic analysis to investigate the whole cellular protein alterations of MDBK cells infected with BPIV3. To investigate the infection process of BPIV3 and the immune response mechanism of MDBK cells, isobaric tags for relative and absolute quantitation analysis (iTRAQ) and Q-Exactive mass spectrometry-based proteomics were performed. The differentially expressed proteins (DEPs) involved in the BPIV3 invasion process in MDBK cells were identified, annotated, and quantitated.
Results
A total of 116 proteins, which included 74 upregulated proteins and 42 downregulated proteins, were identified as DEPs between the BPIV3-infected and the mock-infected groups. These DEPs included corresponding proteins related to inflammatory response, immune response, and lipid metabolism. These results might provide some insights for understanding the pathogenesis of BPIV3. Fluorescent quantitative PCR and western blotting analysis showed results consistent with those of iTRAQ identification. Interestingly, the upregulated protein MKK3 was associated with the p38 MAPK signaling pathway.
Conclusions
The results of proteomics analysis indicated BPIV3 infection could activate the p38 MAPK pathway to promote virus replication.
Introduction
Bovine parainfluenza virus type 3 (BPIV3) is an enveloped, single-stranded negative-sense RNA virus that belongs to the family Paramyxoviridae, genus Respirovirus [1]. BPIV3 infection results in pneumonia and atypical interstitial pneumonia in cattle and leads to severe secondary bacterial infection and other related clinical symptoms. BPIV3 infection and other viral or bacterial infections often cause bovine respiratory disease complex (BRDC) [2]. The cattle mortality by BRDC is up to 35%, which causes huge economic losses in the cattle industry [3]. The genome of BPIV3, approximately 15 kb in size, encodes six structural proteins and three nonstructural proteins [4, 5]. The structural proteins include nucleoprotein (N), phosphoprotein (P), large protein (L), matrix protein (M), hemagglutinin-neuraminidase (HN), and the homotrimeric fusion (F), while the accessory nonstructural proteins include C, V, and D proteins. Multiple functions and activities of the structural and accessory proteins have been investigated. For example, the glycoprotein HN binds to the receptor protein on the host cell surface, followed by the fusion protein F to induce membrane fusion [6, 7]. The conserved, nonglycosolated matrix protein (M), is the most abundant viral protein in an infected cell. The nonstructural proteins including V protein and C protein are also encoded by the P gene. The V, C, and N proteins together regulate virus replication [5]. Although much progress has been made in understanding the proteins of BPIV3, the pathogenetic and immunoregulatory mechanisms involved in the process of BPIV3 infection remain largely unclear. To investigate the changes in the host physiological system during the process of viral invasion, isobaric tags for relative and absolute quantitation analysis (iTRAQ) mass spectrometry (MS)-based global proteomics profiling was performed.
The iTRAQ quantitative proteomics technique has been widely used to study interaction between virus and host based on high sensitivity and quantitation accuracy [8]. An et al. used iTRAQ to determine the differentially expressed proteins (DEPs) of transmissible gastroenteritis virus (TGEV)-infected PK-15 cells, which identified 60 upregulated and 102 downregulated proteins in the TGEV infection process. Their analysis revealed that many upregulated proteins were associated with interferon signaling and that TGEV infection could activate the JAK-STAT1 signaling pathway [9]. In order to provide a scientific basis for the PEDV pathogenesis, the iTRAQ quantitative proteomics technique identified the proteins associated with porcine epidemic diarrhea virus (PEDV) infection [10]. Isobaric tags for relative and absolute quantification (iTRAQ) combined with liquid chromatography-tandem mass spectrometry (LC-MS/MS) approaches have been used to provide the proteomic expression profiles of host cells in response to infections by various viruses, including classical swine fever virus [11], porcine deltacoronavirus [12], influenza A (H1N1) virus [13], and porcine rotavirus [14]. iTRAQ coupled with LC-MS/MS analysis is a robust quantitative proteomics technique for the comprehensive analysis of differentially expressed proteins (DEPs). In the present study, the DEPs in BPIV3-infected MDBK cells were identified and quantitatively analyzed for the first time by the iTRAQ-based proteomics approach. MDBK cells have been selected for use in many studies [15, 16]. Usually MDBK cells are not only used for the isolation, propagation, and basic studies of BPIV3, but also as host many other bovine pathogens, such as bovine respiratory syncytial virus (BRSV) and bovine herpesvirus type 1 [17, 18].
The expression levels of 116 proteins were found to be significantly altered after 24 h of BPIV3 infection. These cellular DEPs were assigned to several biological processes according to bioinformatics analysis. These changes activated the p38 MAPK pathway promoted the BPIV3 replication, providing a global understanding of the host action with BPIV3 infection.
Materials and methods
Virus infection of MDBK cells
MDBK cells were cultured in DMEM (Dulbecco’s modified Eagle’s medium) medium containing 10% fetal bovine serum (FBS) and 100 g /ml penicillin and 100 g /ml streptomycin. Cell culture conditions at 37 °C with 5% CO2 in 24 h. The BPIV3 DQ strain (GenBank accession no. HQ462571) was isolated and identified in the preventive veterinary laboratory of Heilongjiang Bayi Agricultural University. MDBK cells were infected with BPIV3 at multiplicity of infection (MOI = 1). Uninfected cells were used as mock-infected groups. Each experiment was carried out with three replicates. The cytopathic effect (CPE) was observed and the growth curve of BPIV3 was measured. TCID50 were measured by the Reed-Muench method.
Protein isolation, digestion, and labeling with iTRAQ reagents
All the cell samples, including BPIV3-infected group and control group, were cleaned with cold PBS twice and centrifuged at 1000 g at 4 °C for 10 min to harvest cells. Then, the collected cells were lysed to extract proteins in the 300 μL SDT (1 mM PMSF, 2 mM EDTA and 10 mM DTT). The dissolved protein samples were harvested with centrifugation at 1 4000 g for 40 min at 4 °C. The concentration of the protein supernatant was determined using BCA protein assay. The protein 100 μg was digested for 8 h at 37 °C by the sequencing-grade modified trypsin. The protein samples were labeled by different iTRAQ tags on the basis of iTRAQ Reagent-8plex Multiplex Kit instruction (AB SCIEX). Three mock-infected samples were labeled by iTRAQ 113, iTRAQ 114 and iTRAQ 115, respectively; three BPIV3-infected samples were labeled by iTRAQ 116, iTRAQ 117 and iTRAQ 118, respectively. Then the labeled samples were mixed and dried by using vacuum concentrator.
LC–MS/MS analysis
The labeled peptide samples were purified and separated by AKTA purification system. The operation methods and solution preparation were performed essentially as described previously [19]. The whole elution process was monitored at 214 nm and collected every minute. Thirty distillates were collected and neutralized in 10 pools and desalinated in a C18 cartridge. After each fraction was vacuum centrifuged, the sample was dissolved in 40 μL 0.1% trifluoroacetic acid and kept frozen at − 80 °C for mass spectrometry analysis. Each sample was separated by capillary high-performance liquid chromatography (Thermo scientific EASY column (2 cm, 100 μm 5 μm, C18). The chromatography conditions were as follow: Water with 0.1% formic acid (A) and Acetonitirile with 0.1% formic acid (B) as mobile phase. The flow rate was 300 nL per minute and the mobile phase gradient program was used: 0–33 min, from 0 to 40%(B); 33–34 min, from 40 to 100%(B); 34–35 min maintained 100% and then back to 40%. Then, proteins were analyzed by using a Q-Exactive mass spectrometry (Thermo Finnigan) at positive ion mode (parameters: mass range: 300–1800 m/z; Dynamic exclusion: 40.0 s, MS2 Activation Type: HCD, Normalized collision energy: 30 eV).
Database search and bioinformatic analysis
MS/MS data were searched in the bovine subset database from the UniProt database (release March 22, 2016, containing 32 015 sequences) and proteins were identified by Mascot 2.3.02. The peptide for quantification was automatically selected by Paragon™ algorithm to calculate the reporter peak area, error factor (EF) and p-value. The proteins expression levels in BPIV3-infected cells were calculated to compare with those of mock-infected cells. Proteins with fold changes > 1.5 and p-values < 0.05 were considered as significantly different expressions. Auto bias-corrected were executed to decrease artificial error. These proteins were further classified by Gene Ontology (GO) and pathway enrichment analysis (http://www.geneontology.org).
RNA extraction and real-time PCR analysis
The mRNA levels of differentially expressed proteins were analyzed by real-time PCR. Total RNA of the MDBK cells in the BPIV3 infected group and the control group was extracted by TRIzol reagent (Takara) according to the manufacturer’s protocol. The RNA concentration was measured using NanoDropnd-1000. Agarose gel electrophoresis detected the total RNA 1 μL. The cDNAs of these samples were obtained by reverse transcription. Relative quantitative real-time PCR was performed in a 25 μL system that containing 12.5 μL SYBR Premix Ex TaqTM II, 2 μL primers, 2 μL cDNA samples and 8.5 μL water. The reaction condition was 95 °C for 10 min, then 40 cycles of 95 °C for 30 s, 57 °C for 30 s and 72 °C for 30 s. The melting curves were obtained. The gene of GADPH was used as the internal reference gene. All of the primers were used in the PCR tests shown in Table 1. The data statistic was based on three independent experiments.
Western-blot
The infected MDBK cells were washed two times with PBS and disrupted with lysis buffer (50 mM Tris–HCl, pH 8.0, 150 mM NaCl and 1% Triton X-100, supplemented with 1 tablet of Complete-Mini Protease Inhibitor Cocktail per 50 ml buffer). The cell lysates were centrifugated at 12,000 × g for 10 min to harvest supernatants. Protein assays were performed on all supernatants using the Bradford method. For Western blot analysis of the whole-cell lysates, samples, each containing 25–30 μg of protein equivalent, were dissociated in SDS-PAGE loading buffer and separated by 12% gradient SDS-PAGE. Proteins were then transferred to an Immobilon-FL membrane (Millipore). The primary antibodies, including MKK3 (rabbit, Cell Signal Technology5674, Danvers, MA), p38 phosphorylation (p-38) 1:1000 (mouse, Cell Signal Technology9216, Danvers, MA), p-38 1:1000 (rabbit, Cell Signal Technology41666, Danvers, MA), β-actin 1:10,000 (mouse, Sigma), were incubated on the membrane at 4 °C over-night. As a secondary antibody, goat anti-rabbit and goat anti-mouse immunoglobulin G (1:1000, Santa Cruz Biotechnology Inc.) was applied at room temperature for 1 h. After further washes, the immune complexes were revealed by enhanced chemluminescence by the ECL detection kit (Beijing Biosea Biotechnology Co., Ltd.).
Statistical analysis
Statistical analysis was performed in Microsoft Excel for two-tailed Student’s t test or one-way analysis of variance (ANOVA). The p-values < 0.05 were considered statistically significant.
Results
Detection of theBPIV3 activity in MDBK cells
To determine the optimal sampling time point for proteomics analysis after BPIV3 infection, MDBK cells were cultured in a monolayer and inoculated with BPIV3. At different time points 0, 6, 12, 18, 24, 36, and 48 h post inoculation, the cell-virus suspension was harvested and the CPE was observed (Fig. 1A). The TCID50 was measured. The growth curve of BPIV3 was plotted according to the results of TCID50 which showed that BPIV3 proliferated rapidly from 24 to 36 h after infection, indicating active intracellular replication of the virus (Fig. 1B).
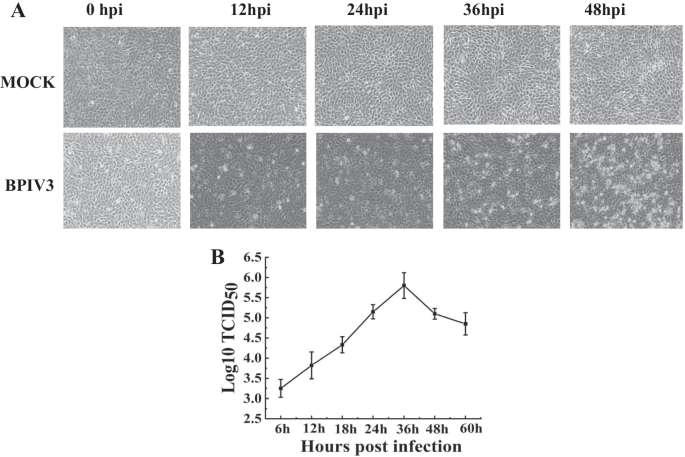
Virus infection. A Photomicrographs of MDBK cells infected with BPIV3 strain DQ at MOI = 1 or mock-infected at different times after infection. Images were taken at an original magnification of 40×. B One-step growth curve of BPIV3 strain DQ in MDBK cells
The MDBK cells were inoculated with BPIV3 at the dose of 1 multiplicity of infection (MOI = 1), and CPE was observed at different time points after infection. The results showed that lesions began apparently at 12 h after BPIV3 infected the cells, and then, became more worse with time (Fig. 1A). The viral titer reached a peak of approximately 5.7 at 36 h and then gradually and continuously declined (Fig. 1B). Generally, the optimal time for a proteomic analysis is when viral replication remains high but no significant host cell cytoskeleton or membrane rearrangement is observed [20]. According to the post-infection cytopathic conditions combined with virus proliferation, cells infected at 24 h were used as the time point for proteomics analysis.
Protein profiling and iTRAQ quantification
The collected protein samples of BPIV3-infected and mock-infected MDBK cells were labeled with iTRAQ reagent in three biological replicates. The quantitative information of the two experimental group ratios (ratio [infection/control]) was obtained by integrating the peptide segment information of three biological duplicates in the mock-infected group (control) and the BPIV3-infected group (infection).
The changes in the protein expression level between the two groups were analyzed based on statistical significance. A total of 2804 proteins were detected and quantified by LC–MS/MS. 116 proteins significantly changed according to P < 0.05 (Fig. 2) and the proteins change ratio of ≥ 1.5. Among these proteins, 74 proteins were significantly upregulated and 42 proteins were markedly downregulated (Table. 2). The most significantly upregulated protein among the DEPs was vesicle-related membrane protein, which is related to autophagy. The most significantly downregulated protein was the integrin complement protein, which is a receptor protein of viral infection (Table. 2).

The quantitation and significance analysis of the 2804 identified proteins from BPIV3-infected and mock-infected groups
GO annotations of the DEPs
GO annotations for DEPs. The proteins were annotated into three major categories: biological process (BP), cellular component (CC), and molecular function (MF) (Fig. 3). The GO enrichment analysis in the biological process showed that the DEPs were significantly enriched in five processes, including single organism process, response to a stimulus, metabolic process, cell process, and biological regulation. The proteins involved in the biological regulation process were found most, followed by those involved in the stimulation response process. In this study, the proteins in the stimulation response process mainly included tyrosine phosphatase, signal transduction protein 1, Rab5 GDP/GTP conversion factor 1, interleukin-13 (IL-13), mitogen-activated protein kinase 7 (MAPK7), FOX transcription inhibitory factor 3 (Foxp3), calcium phosphate, protein tyrosine phosphatase protein receptor, MAP3K10, human telomerase reverse transcriptase, and SSNA1. IL-13 is the most important inflammatory factor that causes airway inflammation. It plays a key role in the occurrence of chronic airway inflammatory disease, which induces high secretion of mucus. Foxp3 is a member of the Fox transcription factor family that plays an important role in maintaining the immune function of the body [21]. The DEPs in BPIV3-infected MDBK cells may cause the initial cellular stress response. The precise role of these DEPs in the BPIV3 infection process need to be further investigated.

Gene ontology (biological process) analysis of the DEPs in BPIV3 groups vs. the control groups. The longitudinal coordinate-axis indicates the number of proteins for each GO annotation, the horizontal axis represents the GO annotations. The blue, biological processes categories of DEPs; red, categories of cell components; yellow, categories of the molecular functions
Kyoto encyclopedia of genes and genomes (KEGG) pathway analysis of the DEPs
The KEGG pathway database is a collection map based on the molecular interaction pathways and cellular response networks. The DEPs were identified and mapped to six KEGG pathways, including metabolism, cellular processes, organismal systems, environmental information process, genetic information process, and disease pathways. The organismal systems and disease pathways were enrichment pathways, represented by 37 and 43 pathway groups, respectively.
In the metabolic pathways, the DEPs participated in 13 pathways related to the metabolism of glucose, lipid, amino acid, and nucleotides (Fig. 4A). These pathways affect the metabolism of three major nutrients in cells. The cellular processes involved 10 pathways (Fig. 4B), including the Focal adhesion pathway and the Phagosome pathway, both of which were involved in the viral infection process. The integrin protein was the key protein in these two pathways. The lysosome pathway, phagosome pathway, and autophagy pathway were all involved in the autophagy process of virus infection. The environmental information involved 11 pathways, mainly focusing on the pathways of viral infection and the interaction of signal molecules (Fig. 4C). Among them, pI3K-Akt signaling pathway, MAPK signaling pathway, Ras signaling pathway and TNF signaling pathway have been proved to be related to virus infection. The annotated proteins in the category of genetic information processing played a role in the synthesis, transport, proteolysis, and spliceosome of cells (Fig. 4D). The annotated proteins in the organismal systems category were related to antigen processing and presentation, NOD-like receptor signaling, Toll-like receptor signaling, complement and coagulation cascades, and Th1 and Th2 cell differentiation pathway groups. These pathways were correlated with the immune response of the host to virus infection (Fig. 4E). The DEPs annotated in the disease category are shown in Fig. 4F. There are ten pathways clustering in infectious diseases, five of which are associated with viral infections.

Analysis of the KEGG pathway of the differentially expressed proteins. A genetic information processing B Metabolism; C environmental information processing; D cellular processes; E organismal systems; F diseases
According to the profiling of DEPs, a relatively large number of proteins were matched with the MAPK signaling pathway, including FGF13, ERK5, and MKK3. The KEGG pathway analysis revealed that MKK3 was involved in 14 pathways, indicating that MKK3 was a key regulatory protein during BPIV3 infection to MDBK cells (Table. 2).
Validation of the selected proteins by real-time quantitative PCR (qRT-PCR)
To verify the DEPs identified by iTRAQ, the transcriptional levels of eight proteins were measured by qRT-PCR. In this study, the eight proteins were randomly selected for qRT-PCR. The four of them upregulated proteins included AP-2 complex subunit beta protein (AP-2), FGF13, myristoylated alanine-rich C-kinase substrate (MARCS), and MKK3 proteins. The other four downregulated proteins included MHC class II (MHCII), glutathione S-transferase (GSTA1), selenium protein P (SepP), and tissue factor pathway inhibitor (TFPI). As shown in Fig. 5, the expression levels of these genes were consistent with the iTRAQ results. The results of qRT-PCR further verified the reliability of the iTRAQ experiment.
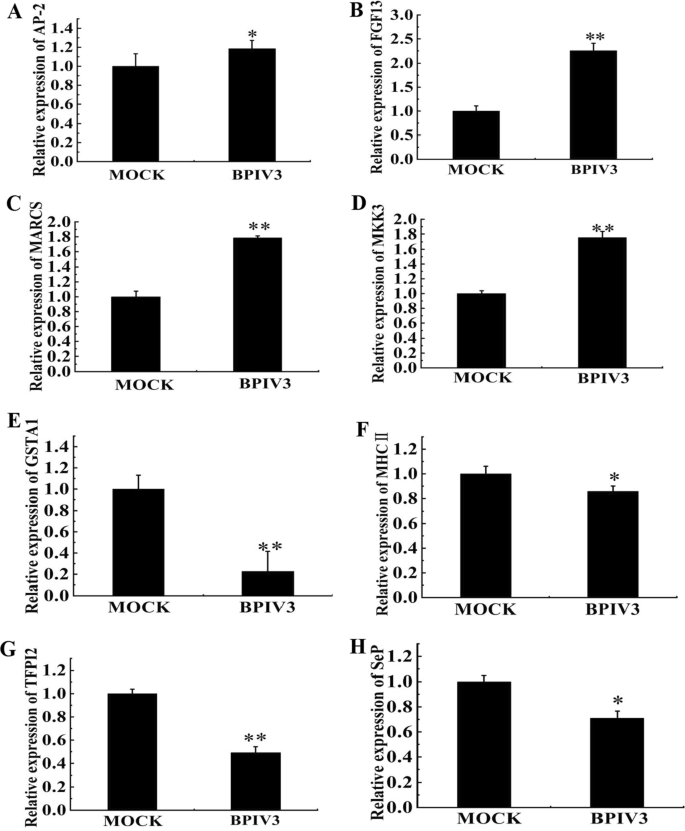
Real-time RT-PCR analysis of the DEPs in BPIV3-infected cells and controls. MDBK cells were infected with BPIV3 at MOI = 1 or mock-infected. The cells were collected at 24 hpi for real-time RT-PCR to analyze the relative expression of 8 differential expression genes. A AP-2; B FGF13; C MARCS; D MKK3; E GSTA1; F MHCII; G TFPI2; H SepP
The effect of the p38 MAPK pathway on BPIV3 replication
BPIV3 infection activating the p38 MAPK pathway
The MAPK pathway plays various roles in intracellular signaling network. MKK3 and MKK6 are recognized as upstream kinases of p38. The results of proteomics analysis showed that the MKK3 level was significantly upregulated after BPIV3 infection (Table. 2). Virus infection is considered as an extracellular stimulant that can activate p38 MAPK pathway [22, 23]. It should be investigated whether BPIV3 infection activated the p38 MAPK pathway after MKK3 activation.
The expression of MKK3, p38, and phospho-p38 in BPIV3-infected cells was detected by western blotting assay. Cell samples were collected at 6, 12, and 24 h post BPIV3 infection. Compared to the mock group, the MKK3 expression levels were increased at different infection time points in the infected group. No change was observed in the p38 protein expression level, while the phospho-p38 expression level was significantly higher in the infected group than in the mock group at 12 h and 24 h after BPIV3 infection (Fig. 6). Thus, BPIV3 infection induced MKK3 activation and p38 phosphorylation. The MKK3 expression level was consistent with previous proteomics results, which further verified the reliability of proteomics analysis.

The p38 MAPK pathway was activated by BPIV3 infection. The MDBK cells were collected in mock-infected group or BPIV3-infected group (MOI = 1) from 6 to 24 h. MKK3, p38 phosphorylation and total amount of p38 were analyzed in whole-cell lysates by Western blot. The primary antibodies were the specific anti-phospho-p38 antibodies (mouse, 9216, CST, USA), anti-p38 antibodies (rabbit, 41666, CST, USA) and anti-MKK3 antibodies (rabbit, 5674, CST, USA), the second antibodies were goat anti-mouse and goat anti-rabbit IgG. β-actin probed with specific monoclonal antibody was served as internal control. Densitometry scans were conducted by ImageJ software (NIH, USA). Densitometry of the phospho-p38 band was normalized to p38, which was presented as fold change ± SEM compared with the mock-infected control defined as 1. These data were from three independent experiments. Significant differences compared with mock-infected control are denoted by *(P < 0.05), ** (P < 0.01). The Same densitometry analysis and statistical analysis were performed in the following experiments. A The protein expression in p38 MAPK pathway by Western blot; B Expression of MKK3; C Expression of p-p38; D Expression of p38
The effect of inhibiting p38 MAPK activation on BPIV3 replication
To investigate whether the activation of the p38 MAPK pathway promotes BPIV3 proliferation, the cells were treated with SB202190, an inhibitor of the p38 MAPK pathway, at 1 h before infection. The MDBK cells were treated with SB202190 at concentrations of 1.25, 5, and 10 μM. Cell samples were collected at 24 h after infection (MOI = 1).
The results are shown in Fig. 7. The BPIV3 infection induced the phosphorylation of p38. After treatment with the inhibitor SB202190, the expression level of p38 was significantly decreased in a dose-dependent manner, indicating that the phosphorylation of p38 was inhibited by SB202190 (Fig. 7A and B). The BPIV3 virus titer decreased by 1.8 logTCID50/mL after treatment with 10 μM SB202190, indicating that the p38 MAPK pathway participates in the replication of BPIV3 (Fig. 7C). The results showed that SB202190 could inhibit the proliferation of BPIV3. Thus, BPIV3 activated the p38 MAPK signaling pathway that is involved in its replication.

Inhibition of activation of the p38 pathway inhibits BPIV3 replication. The MDBK cells were treated with SB202190 at 1.25, 5, and 10 μM concentrations. After 1 h, BPIV3-infected cells were inoculated with MOI = 1. The cell samples were collected at 24 h after infection, and the following tests were performed. (A and B) SB202190 impact on p38MAPK phosphorylation. Cell samples were collected 24 h after infection, lysed with cell lysate, and the expression of phospho-p38 and β-actin in the samples was detected by Western-blot; (C)SB202190 impact on Bpiv3 TCID50. The cell supernatant was collected 24 h after infection, and the titer of the virus was detected by TCID50 assay. ** (P < 0.01)
Discussion
iTRAQ LC-MS/MS is a powerful analytical tool for quantitative proteomics analysis that has been widely used in many studies [24,25,26,27]. Gray et.al used 2D gel electrophoresis proteomic to investigate in vitro cellular responses during BPIV3 infection [28]. In the present study, we first applied the iTRAQ LC-MS/MS approach to determine the profiles of DEPs in MDBK cells infected with BPIV3 at 24hpi. A total of 116 DEPs were identified at 24 h after infection. On the basis of GO analysis, the DEPs were classified into 19, 11, and 9 categories for biological processes, cellular components, and molecular functions, respectively (Fig. 3). The pathway analysis identified the pathways based on the number of DEPs (Fig. 4). These data could provide a basis for understanding the pathogenetic mechanisms of BPIV3 infection.
The results showed that the PI3K-Akt signaling pathway and the MAPK signaling pathway play important roles in the progression of BPIV3 infection. According to the profiles of DEPs in these two signaling pathways, only ITGB3 was downregulated, while the remaining proteins were upregulated. Interestingly enough, the number of matched proteins in the MAPK signaling pathway was relatively large, including FGF13, ERK5, and MKK3. The KEGG pathway analysis further indicated that MKK3 was involved in 14 pathways, which suggested that MKK3 is a key regulatory protein during BPIV3 infection. Previous studies have shown that the MAPK signaling pathway is a target of respiratory viruses, which regulates various stages of the infection process [29, 30].
The MAPK cascade plays various roles in intracellular signaling network pathways. MKK3 and MKK6 are recognized as upstream kinases of p38 that can directly phosphorylate tyrosine and serine/threonine residues to activate p38 [31]. Viral infection is thought to be an extracellular stimulant that activates this pathway. Immunohistochemical detection showed that the phosphorylation level of p-ERk1/p-p38 in the lungs of sheep infected with infectious salmon anemia virus (ISAV) was significantly increased compared to that in healthy sheep [22]. In our proteomics study, the MKK3 level was significantly upregulated at 24 h after BPIV3 infection compared to that in the control group. Therefore, we detected the protein expression level in the p38 MAPK pathway after BPIV3 infection.
First, we investigated whether BPIV3 infection activates the p38 MAPK pathway. The results showed that BPIV3 induced the phosphorylation of p38 after infection. Compared to the control group, the phosphorylated p38 expression was significantly increased after 6 h of BPIV3 infection, demonstrating that BPIV3 could induce the activation of the p38 MAPK pathway in the early stage of infection.
Multiple extracellular stresses activate the MKK3-p38 MAPK cascade, including specific antigens, proinflammatory cytokines, ultraviolet light, heat shock, and other stress responses [32]. In accordance with the results of the mechanism of Coxsackie virus activation of p38 MAPK, MKK3-p38 MAPK was temporarily activated in the early stage of infection [33]. The same results were found in our study, MKK3-p38 MAPK was activated at 6 h post BPIV3 infection. As the BPIV3 infection was gradually prolonged, the phosphorylation of p38 MAPK was more significantly increased at 24 h after infection. In the late stage of infection, p38 was still continuously activated, which was speculated to be due to the release of proinflammatory cytokines induced by BPIV3 infection. These released proinflammatory cytokines bound to the receptor further enhanced the activation in the p38 MAPK pathway [34, 35].
Many studies have shown that p38 is required for the replication of viruses. The activation of the MAPK pathways by viruses such as stimulates the JNK and p38 MAPK pathways to promote the release of virions [32]. In porcine reproductive and respiratory syndrome virus infection, the virus replication was inhibited after inhibition of the JNK and p38 pathways [36]. The same results were noted in PEDV infection [37]. To detect the role of the p38 MAPK pathway in BPIV3 replication, virus titer was analyzed. We found the inhibitor SB202190 significantly inhibited BPIV3 replication in a dose-dependent manner. It was also found that p38 expression was inhibited after treatment with SB202190. Compared with the untreated group, the virus titer was significantly decreased in the inhibitor treatment cells. These results revealed that the activation of the p38 MAPK pathway facilitated replication of BPIV3.
Conclusion
In this study, DEPs in BPIV3-infected MDBK cells were identified and quantitatively analyzed by iTRAQ and LC-MS-based proteomics analysis. Most of the DEPs were proteins related to inflammatory response, immune response, and lipid metabolism. Although many significantly up- or downregulated proteins and pathways are closely related to the symptoms or pathological responses to BPIV3 infection, further functional investigations are required to understand the pathogenic mechanisms and molecular responses of host cells to BPIV3 infection.
The results of the present study indicated that BPIV3 infection activates the p38 MAPK pathway, which is essential for its replication. Proteomics and western blot analyses showed that BPIV3 infection activated the p38 MAPK signaling pathway. Our future research will focus on which step of virus replication is affected by p38 activation.
Availability of data and materials
Not applicable.
Abbreviations
- BPIV3:
-
Bovine parainfluenza virus type 3
- BRDC:
-
Bovine respiratory disease complex
- iTRAQ:
-
Isobaric tags for relative and absolute quantitation analysis
- DEPs:
-
Differentially expressed proteins
- TGEV:
-
Transmissible gastroenteritis virus
- PEDV:
-
Porcine epidemic diarrhea virus
- BRSV:
-
Bovine respiratory syncytial virus
- DMEM:
-
Dulbecco’s modified Eagle’s medium
- FBS:
-
Fetal bovine serum
- CPE:
-
Cytopathic effect
- GO:
-
Gene ontology
- IFA:
-
Indirect immuno- fluorescent assay
- MOI:
-
Multiplicity of infection
- IL-13:
-
Interleukin-13
- MAPK7:
-
Mitogen-activated protein kinase 7
- Foxp3:
-
FOX transcription inhibitory factor 3
- MARCS:
-
Myristoylated alanine-rich C-kinase substrate
- MHCII:
-
MHC class II
- GSTA1:
-
Glutathione S-transferase
- SepP:
-
Selenium protein P
- TFPI:
-
Tissue factor pathway inhibitor
References
Kale M, Dylek O, Sybel H, et al. Some viral and bacterial respiratory tract infections of dairy cattle during the summer season. Acta Vet-Beogr. 2013;63(2–3):227–36.
Kirchhoff J, Uhlenbruck S, Goris K, et al. Three viruses of the bovine respiratory disease complex apply different strategies to initiate infection. Vet Res. 2014;45:12.
Grissett GP, White BJ, Larson RL. Structured literature review of responses of cattle to viral and bacterial pathogens causing bovine respiratory disease complex. J Vet Intern Med. 2015;29(3):770–80.
Ellis JA. Bovine parainfluenza-3 virus. Vet Clin N Am Food Anim Pract. 2010;26(3):575–93.
Durbin AP, McAuliffe JM, Collins PL, et al. Mutations in the C, D, and V open reading frames of human parainfluenza virus type 3 attenuate replication in rodents and primates. Virology. 1999;261(2):319–30.
Bousse T, Takimoto T. Mutation at residue 523 creates a second receptor binding site on human parainfluenza virus type 1 hemagglutinin-neuraminidase protein. J Virol. 2006;80(18):9009–16.
Jardetzky TS, Lamb RA. Activation of paramyxovirus membrane fusion and virus entry. Curr Opin Virol. 2014;5:24–33.
Gerold G, Bruening J, Pietschmann T. Decoding protein networks during virus entry by quantitative proteomics. Virus Res. 2016;218:25–39.
An K, Fang LR, Luo R, et al. Quantitative proteomic analysis reveals that transmissible gastroenteritis virus activates the JAK-STAT1 signaling pathway. J Proteome Res. 2014;13(12):5376–90.
Sun DB, Shi HY, Guo DH, et al. Analysis of protein expression changes of the Vero E6 cells infected with classic PEDV strain CV777 by using quantitative proteomic technique. J Virol Methods. 2015;218:27–39.
Zhou N, Fan C, Liu S, et al. Cellular proteomic analysis of porcine circovirus type 2 and classical swine fever virus coinfection in porcine kidney-15 cells using isobaric tags for relative and absolute quantitation-coupled LC-MS/MS. Electrophoresis. 2017;38(9–10):1276–91.
Zhou X, Zhou L, Ge X, et al. Quantitative proteomic analysis of porcine intestinal epithelial cells infected with porcine deltacoronavirus using iTRAQ-coupled LC-MS/MS. J Proteome Res. 2020;11:4470–85.
Ding XM, Wang YF, Lyu Y, et al. The effect of influenza A (H1N1) pdm09 virus infection on cytokine production and gene expression in BV2 microglial cells. Virus Res. 2022;312:198716.
Zhou JZ, Huang SM, FanBC, et al. iTRAQ-based proteome analysis of porcine group A rotavirus-infected porcine IPEC-J2 intestinal epithelial cells. J Proteomics. 2021;248:104354.
Li LY, Yu LY, Hou XL. Cholesterol-rich lipid rafts play a critical role in bovine parainfluenza virus type 3 (BPIV3) infection. Res Vet Sci. 2017;114:341–7.
Zhu YM, Shi HF, Gao YR, et al. Isolation and genetic characterization of bovine parainfluenza virus type 3 from cattle in China. Vet Microbiol. 2011;149(3–4):446–51.
Chowdhury SI, Coats J, Neis RA, et al. A bovine herpesvirus type 1 mutant virus with truncated glycoprotein E cytoplasmic tail has defective anterograde neuronal transport in rabbit dorsal root ganglia primary neuronal cultures in a microfluidic chamber system. J Neurovirol. 2010;16(6):457–65.
Yazici Z, Ozan E, Tamer C, et al. Circulation of indigenous Bovine respiratory syncytial virus strains in Turkish cattle: the first isolation and molecular characterization. Animals. 2020;10(9):10.
Guo XZ, Hu H, Chen FZ, et al. iTRAQ-based comparative proteomic analysis of Vero cells infected with virulent and CV777 vaccine strain-like strains of porcine epidemic diarrhea virus. J Proteomics. 2016;130:65–75.
Zhang LK, Chai F, Li HY, et al. Identification of host proteins involved in Japanese encephalitis virus infection by quantitative proteomics analysis. J Proteome Res. 2013;12(6):2666–71.
Khattri R, Cox T, Yasayko SA, et al. An essential role for Scurfin in CD4(+)CD25(+)T regulatory cells. J Immunol. 2017;198(3):993–8.
Olavarria VH, Recabarren P, Fredericksen F, et al. ISAV infection promotes apoptosis of SHK-1 cells through a ROS/p38 MAPK/Bad signaling pathway. Mol Immunol. 2015;64(1):1–8.
Fu YL, Yip A, Seah PG, et al. Modulation of inflammation and pathology during dengue virus infection by p38 MAPK inhibitor SB203580. Antiviral Res. 2014;110:151–7.
Li XF, Wang Q, Gao YN, et al. Quantitative iTRAQ LC-MS/MS proteomics reveals the proteome profiles of DF-1 cells after infection with subgroup J Avian Leukosis virus. Biomed Res Int. 2015;2015:10.
Lu Q, Bai J, Zhang LL, et al. Two-dimensional liquid chromatography-tandem mass spectrometry coupled with isobaric tags for relative and absolute quantification (iTRAQ) labeling approach revealed first proteome profiles of pulmonary alveolar macrophages infected with porcine reproductive and respiratory syndrome virus. J Proteome Res. 2012;11(5):2890–903.
Hu F, Li YF, Yu KX, et al. Proteome analysis of reticuloendotheliosis-virus-infected chicken embryo fibroblast cells through iTRAQ-based quantitative proteomics. Arch Virol. 2019;164(12):2995–3006.
Zhong CY, Li JZ, Mao L, et al. Proteomics analysis reveals heat shock proteins involved in caprine parainfluenza virus type 3 infection. BMC Vet Res. 2019;15:14.
Gray DW, Welsh MD, Doherty S, et al. Identification of candidate protein markers of Bovine Parainfluenza Virus Type 3 infection using an in vitro model. Vet Microbiol. 2017;203:257–66.
Wang C, Wei D, Xu M, et al. The Role of p38MAPK in acute lung injury induced by H9N2 influenza virus isolated from swine. Acta Veterinaria et Zootechnica Sinica. 2014;45(2):281–8.
Lee N, Wong CK, Chan PKS, et al. Hypercytokinemia and hyperactivation of phospho-p38 mitogen-activated protein kinase in severe human influenza a virus infection. Clin Infect Dis. 2007;45(6):723–31.
Coskun M, Olsen J, Seidelin JB, et al. MAP kinases in inflammatory bowel disease. Clin Chim Acta. 2011;412(7–8):513–20.
Gautier A, Deiters A, Chin JW. Light-activated kinases enable temporal dissection of signaling networks in living cells. J Am Chem Soc. 2011;133(7):2124–7.
Si XN, Luo HL, Morgan A, et al. Stress-activated protein kinases are involved in coxsackievirus B3 viral progeny release. J Virol. 2005;79(22):13875–81.
Pettus LH, Wurz RP. Small molecule p38 MAP kinase inhibitors for the treatment of inflammatory diseases: novel structures and developments during 2006–2008. Curr Top Med Chem. 2008;8(16):1452–67.
Choi MS, Heo J, Yi CM, et al. A novel p38 mitogen activated protein kinase (MAPK) specific inhibitor suppresses respiratory syncytial virus and influenza A virus replication by inhibiting virus-induced p38 MAPK activation. Biochem Biophys Res Commun. 2016;477(3):311–6.
An TQ, Li JN, Su CM, et al. Molecular and cellular mechanisms for PRRSV pathogenesis and host response to infection. Virus Res. 2020;286:11.
Lee C, Kim Y, Jeon JH. JNK and p38 mitogen-activated protein kinase pathways contribute to porcine epidemic diarrhea virus infection. Virus Res. 2016;222:1–12.
Acknowledgements
Not applicable.
Funding
This project was supported by the Heilongjiang Bayi Agricultural University natural science talent project (ZRCQC201808), Heilongjiang Agricultural Administration Bureau scientific research projects (HKKYZD190305), Post-doctoral Scientific Foundation of HeiLongJiang Province (LBH-Z20204), Heilongjiang Bayi Agricultural University Doctor’s Research Foundation, (XDB201816), Heilongjiang Bayi Agricultural University Scientific Research Team Support project (TDJH201904), Da qing Science and technology project(zd-2021-69).
Author information
Authors and Affiliations
Contributions
LL and PL performed proteomics experiment, analysed the experimental data, and were major contributors in writing the manuscript. AC perfomed cell culture and TCID50 examination. HL performed the qRT-PCR examination. ZL performed the western-blot examination. LY revised manuscript. XH designed all experiments and analysed the experimental data. All authors read and approved the final manuscript.
Corresponding authors
Ethics declarations
Ethics approval and consent to participate
Not applicable.
Consent to publication
Not applicable.
Competing interests
The authors declare that there are no conflicts of interest.
Additional information
Publisher's Note
Springer Nature remains neutral with regard to jurisdictional claims in published maps and institutional affiliations.
Rights and permissions
Open Access This article is licensed under a Creative Commons Attribution 4.0 International License, which permits use, sharing, adaptation, distribution and reproduction in any medium or format, as long as you give appropriate credit to the original author(s) and the source, provide a link to the Creative Commons licence, and indicate if changes were made. The images or other third party material in this article are included in the article's Creative Commons licence, unless indicated otherwise in a credit line to the material. If material is not included in the article's Creative Commons licence and your intended use is not permitted by statutory regulation or exceeds the permitted use, you will need to obtain permission directly from the copyright holder. To view a copy of this licence, visit http://creativecommons.org/licenses/by/4.0/. The Creative Commons Public Domain Dedication waiver (http://creativecommons.org/publicdomain/zero/1.0/) applies to the data made available in this article, unless otherwise stated in a credit line to the data.
About this article

Cite this article
Li, L., Li, P., Chen, A. et al. Quantitative proteomic analysis shows involvement of the p38 MAPK pathway in bovine parainfluenza virus type 3 replication. Virol J 19, 116 (2022). https://doi.org/10.1186/s12985-022-01834-x
Received:
Accepted:
Published:
DOI: https://doi.org/10.1186/s12985-022-01834-x